Thursday, September 10, 2026 / by Shiela Balanay
Ontario MLS® Home Sales Remain Below Last Year’s Levels in August

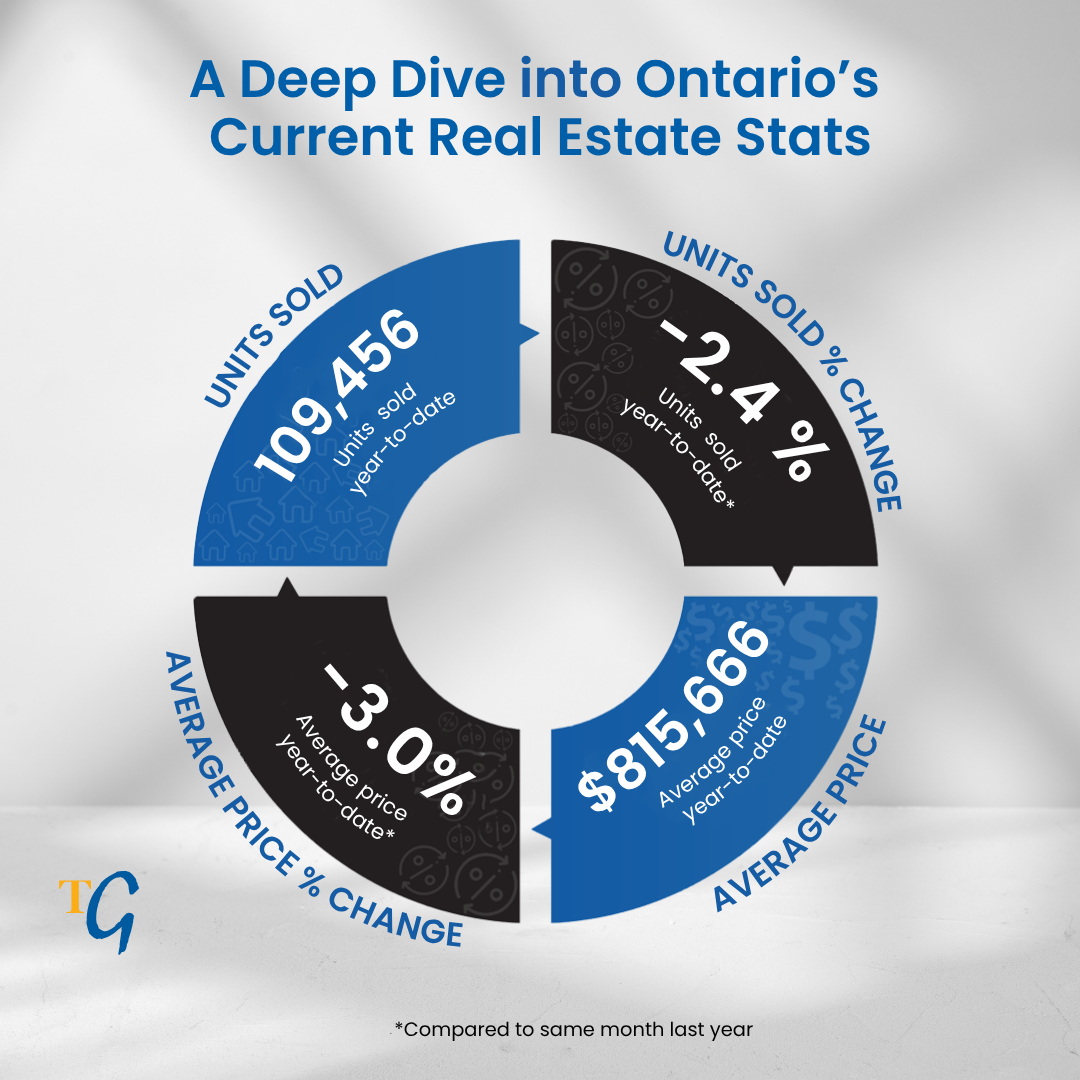
Provincial Overview: Ontario
Real Estate Residential sales activity reported through the MLS® Systems of real estate boards in Ontario totalled 109,456 units over the first eight months of the year, down 2.4% from the same period in 2025. August marked the lowest home sales total for the month in 25 years, highlighting the slower pace of activity across the province. The more comprehensive year-to-date average price was $815,666, a modest 3% decrease from the first eight months of 2025. With both sales and average prices trending lower year over year, Ontario’s housing market continues to reflect a more measured pace as buyers and sellers adjust to current conditions.
Spotlight On: London, ON
This Year (Year-to-Date)
- Home Sales Activity: Total home sales dropped 4.4% compared to the same period in 2025, reaching 4,704 units.
- Average Sale Price: The region's overall year-to-date average home price stands at $620,282, down 4.2% year-over-year.
- Supply & Demand: Months of Inventory averaged 5.1 months (up from 4.5 months in 2025), showing a steady shift toward buyer-favored market conditions.
Last Month (August, 2026)
- Shift to a Buyer's Market: Active inventory hit a 10-year high at 3,332 listings (+7.9% YoY), driving Months of Inventory up to 6.3 and the Sales-to-New-Listings ratio down to 37.5%.
- Cooling Monthly Sales: Transactions fell 14.3% year-over-year to 526 units sold.
- Price Adjustments: The average home price fell 9.3% year-over-year to $590,550, while the composite HPI benchmark price dipped to $553,500 (-2.9% YoY).
- Property Segment Breakdown: Detached single-family homes averaged $642,453 (-8.1% YoY), townhouses averaged $450,299 (-7.6% YoY), and condo apartments experienced the largest drop, averaging $312,086 (-10.0% YoY).
London, ON Statistics: https://tinyurl.com/ywfye68e